In this article, we will use the Pathways Tool to investigate the pathways related to gene-expression patterns in a Next-Generation Clustered Heat Map (NG-CHM). Specifically, we will explore our TCGA THYM rnaSEQ gene by sample map. The samples in this map have been grouped into four clusters based on hierarchical gene-expression clustering, as shown in the top covariate bar.
When exploring gene-expression clusters, I like to switch into horizontal ribbon mode by clicking on the horizontal mode button in the top pane:
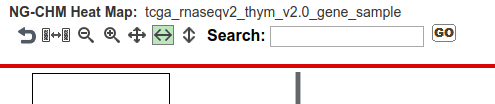
NG-CHM Horizontal Ribbon mode selected
The second (from the top) group of highly correlated genes show different expression levels between clusters, from low in the leftmost (red) cluster to high in the rightmost (green) cluster:

Section of NG-CHM overview pane showing the first gene cluster of interest
To examine the pathways related to genes in this gene cluster, we must first select all the genes in the cluster. The easiest way is to zoom out until the entire cluster (or almost the entire cluster) is visible in the rightmost pane, then select in the rightmost pane the dendrogram branch for the entire gene cluster. Alternatively, select the first gene in the cluster then move to the last gene in the cluster and shift-select it (select it while holding down the shift key). The figure above shows the summary (left) pane when the entire gene cluster has been selected.
Now zoom in until the gene labels are visible, right-click to display the Row Label Menu and select “View matching pathways” from near the bottom of the menu:
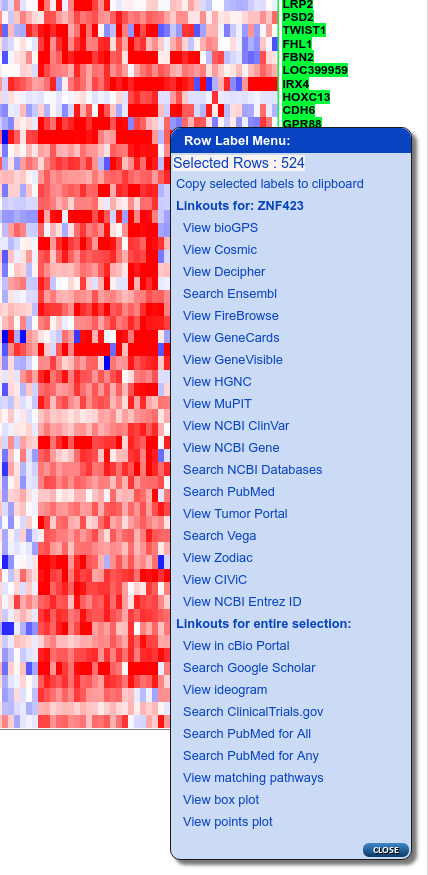
Row label menu showing 'View matching pathways' linkout (3rd from bottom)
The NG-CHM system will then:
- Open a new window (see below),
- Download the pathways containing any of the selected genes from the MD Anderson Pathways Web, and
- Construct a data table that shows the pathways to which the selected genes belong.
If a large number of genes were selected, steps two and three may take a few moments.
The Pathways Table
Once generated, the pathways table will look something like this:
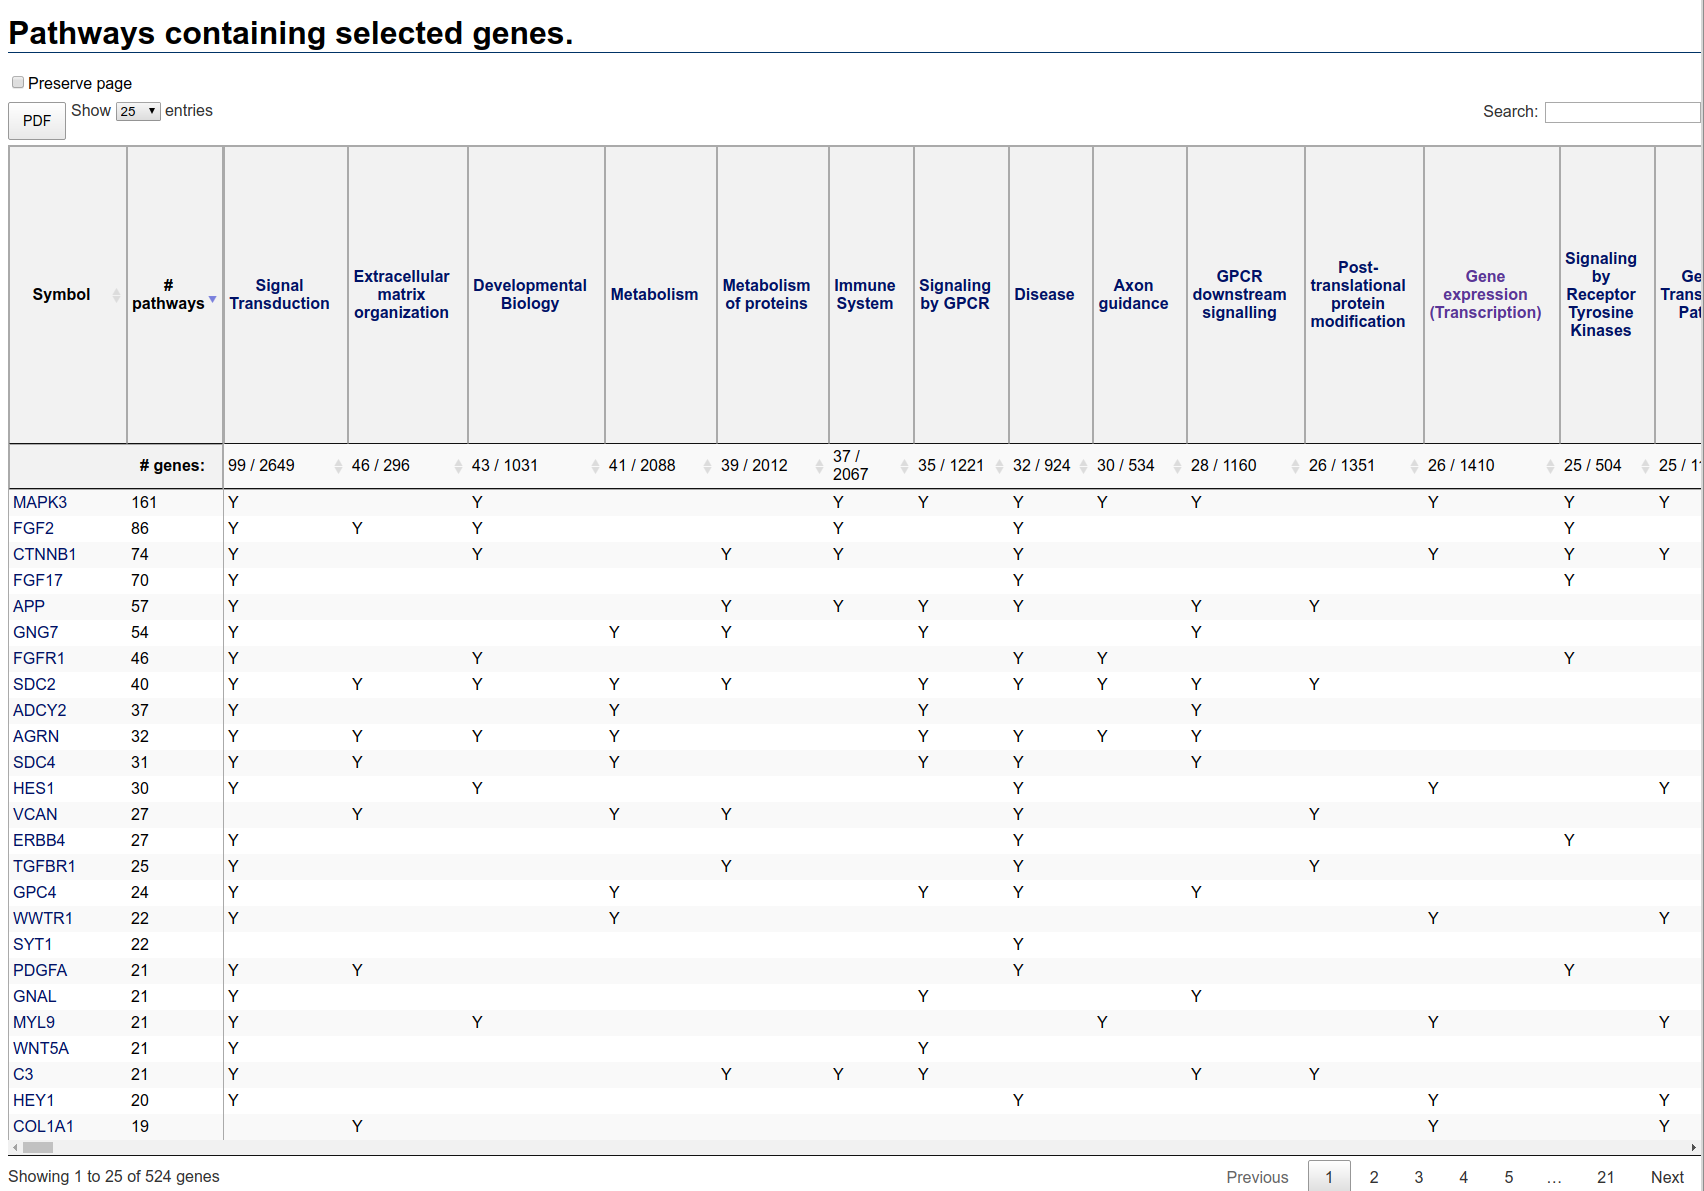
Pathways table initial view
The first column is the gene symbol, the second column is the number of pathways in which that gene appears. By default, the rows are ordered by descending number of pathways.
The remaining columns correspond to pathways containing at least one selected gene. The second header row displays two numbers: the number of selected genes in the pathway and the total number of genes in the pathway. The pathways columns are ordered by descending number of selected genes in the pathway.
Note that no enrichment calculation has been performed. Thus, large pathways are expected to contain a large number of genes just by chance. In this table, for instance, the pathway containing the most selected genes (Signal Transduction) is very large, containing a total of 2649 genes. The actual number of selected genes in this pathway is just 99, a relatively small proportion.
In contrast, the second pathway (Extracellular matrix organization) contains 46 selected genes from a total of 296 genes. Note that the entire heat map contains only 3486 genes, or about one-sixth of all human genes. If inclusion in the map was random (which it is not), you would expect the entire heat map to contain about one sixth of 296 or about 49 genes. Since just the selected genes by themselves contain nearly this number of genes, it is likely that this pathway is enriched in the selection.
Using the scroll bar at the bottom of the table you can scroll to the right to see if any other pathways are more highly enriched. In this table the pathway
Non-integrin membrane-ECM Interactions contains just 42 genes, of which 10, or about a quarter, are included in the selection. Perhaps worthy of
further investigation. To see all relevant genes, you can resort the table by clicking on the resort button to the right of the number of genes in the pathway. You have to
click twice (the first click sorts in the wrong order). After resorting on this pathway, the table looks like:
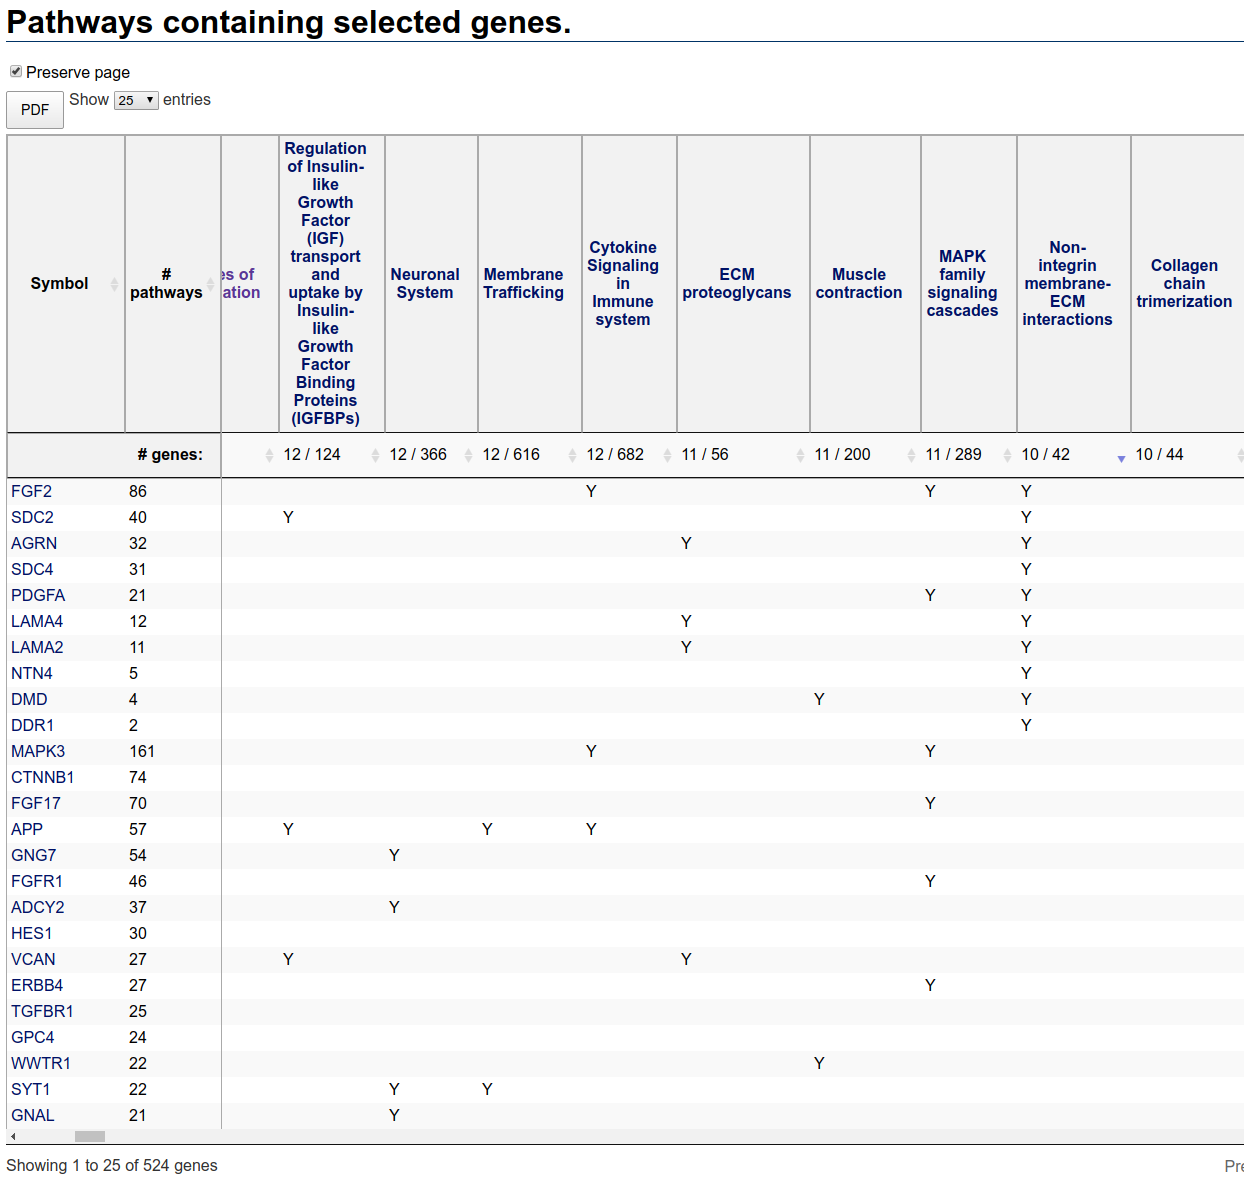
Pathways table after sorting based on Non-Integrin membrane-ECM interactions pathway
Exploring Additional Gene Clusters
You can investigate another gene cluster by selecting the gene cluster in the NG-CHM and selecting “View matching pathways” from the row label menu.
If the pathways page is already open, “View matching pathways” will by default replace the existing content of the page. You can prevent this by
selecting the “Preserve page” checkbox at the top of window before selecting “View matching pathways”:
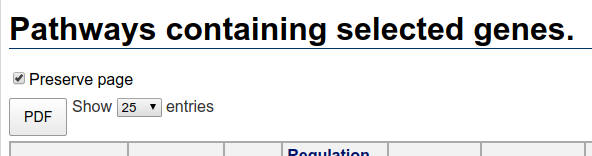
Preserve Page Checkbox: select the checkbox if you do not want 'View matching pathways' to overwrite the page.
A second gene cluster occurs in about the middle of the heat map and is highly expressed in only a small subset of samples:
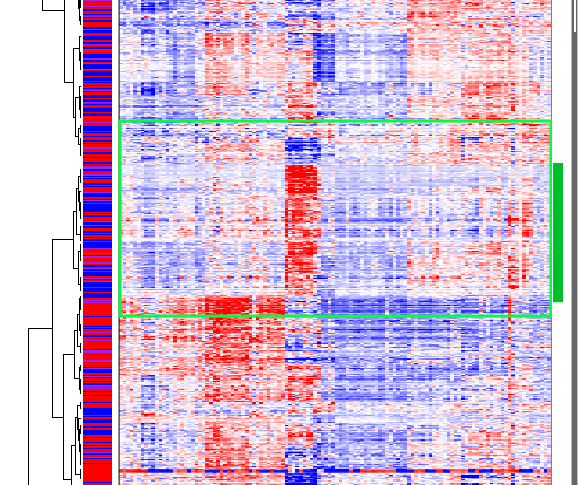
Gene Cluster 2
The third gene cluster occurs near the bottom of the heat map:
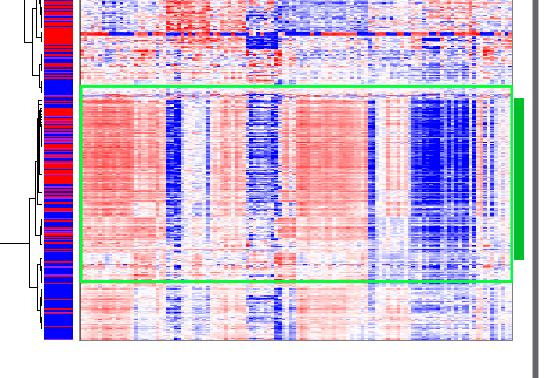
Gene Cluster 3
Interestingly, samples that are highly expressed in gene cluster two are lowly expressed in gene cluster three, and samples that are highly expressed in gene cluster three are lowly expressed in gene cluster two. Some samples are lowly expressed in both gene clusters.
Large pathways such as ‘Immune System’ and ‘Signal Transduction’ are highly represented in both clusters. But enriched pathways in gene cluster two include ‘Interleukin-4 and 13 signaling’ (15⁄111), ‘IL-12 mediated signaling events’ (13⁄65), ‘Interleukin-10 signaling’ (11⁄48), and perhaps ‘Downstream signaling in naive CD8+ T cells’ (11⁄73). In contrast, enriched pathways in gene cluster three include ‘TCR signaling in naive CD4+ T cells’ (20⁄67), ‘TCR signaling in naive CD8+ T cells’ (17⁄53), ‘Cell Cycle’ (69⁄596), ‘Cell Cycle, Mitotic’ (60⁄490), and ‘FOXM1 transcription factor network’ (13⁄42).
Summary
In this article we have reviewed how to use the ‘View matching pathways’ linkout to explore the biology of gene clusters in a Next-Generation Clustered Heat Map. The ‘View matching pathways’ linkout is available for NG-CHMs stored on an NG-CHM server, such as tcga.ngchm.net, that implements the statistical tool box.